Start with the field demand
The useful question is not how much organic material is available, but which nutrients a crop can use at a particular time and place. Manure, compost and digestate differ in their nitrogen availability, phosphorus content, moisture and handling needs. A field plan starts with soil tests, crop demand and local rules, then works backwards to material testing and application. Treating every tonne as interchangeable invites both shortages and surplus.
Follow the whole route
Nutrients move from feed and bedding into livestock, storage, processing and finally the field. At every step there may be useful recovery or loss. Urine nitrogen is particularly vulnerable to ammonia loss, while storage and field application can also create greenhouse-gas and water-quality trade-offs. The FAO's nutrient-cycling overview treats collection, storage and application as one system for this reason.
Separate nitrogen from phosphorus decisions
A single application rate can fit one nutrient target and oversupply another. Phosphorus accumulation and nitrogen timing therefore deserve separate checks, especially where livestock density is high. Where the local crop area cannot use all recovered nutrients, processing and transport may matter more than simply changing the spreading date.
Measure, then adapt
A defensible plan records the source and analysis of the material, field and crop, intended rate, weather constraints and observed result. The numbers will vary by farm and jurisdiction. This guide is a framework for questions to ask, not a fertiliser prescription. Consult local agronomic and legal guidance before application.
Sources & further reading
- FAO: Climate-Smart Agriculture Sourcebook (2013), livestock chapter ↗
- FAO: Organic Matter Database ↗
- Wageningen University & Research: Manure management options ↗
Editorial guide. Local regulations, material testing and qualified advice govern real-world application.
Build a field nitrogen and phosphorus balance
A field balance begins with a boundary and a period, not with an application recommendation. Decide whether you are accounting for one field, a farm gate or a whole catchment. A material leaving one field may remain inside the farm. Record nitrogen and phosphorus separately, using the same area and time period for every term. Soil results, crop demand, material analysis and local application rules remain separate inputs to an agronomic decision.
Use units that can be reconciled
Express the example as kilograms of nutrient per hectare for one season. A fertiliser label may report phosphorus as P₂O₅ while an analysis reports elemental P. They cannot be added directly. FAOSTAT's December 2025 metadata documents the conversion factor 0.436 from P₂O₅ to elemental P. Record the original label as well as the converted value, and keep the nutrient concentration and material mass on a consistent wet- or dry-matter basis.
For an illustrative application of 20 tonnes of fresh material per hectare containing 3 kg total N per fresh tonne, the input is 60 kg total N/ha. If that concentration instead refers to dry matter, the multiplication is not valid without a dry-matter conversion. Total N is also not the same quantity as immediately crop-available N. Preserve those distinctions in the table rather than silently changing the label.
Worked example: a deliberately partial balance
Invented teaching values, not a field prescription: mineral input supplies 100 kg N/ha and 20 kg elemental P/ha; the organic material supplies 60 kg total N/ha and 12 kg elemental P/ha. Harvested crop removes 110 kg N/ha and 25 kg elemental P/ha. The selected-input-minus-harvest calculation is N: 100 + 60 − 110 = 50 kg N/ha; P: 20 + 12 − 25 = 7 kg P/ha.
Call these partial apparent balances. They do not measure nitrate leaching, ammonia emissions, a soil-stock increase or a recommended next dose. Add biological fixation, deposition, irrigation, residue export and other relevant flows when the chosen boundary requires them. In a complete mass balance, change in stock and all inflows and outflows must be reconciled; missing terms remain missing.
Convert crop removal with its evidence attached
Record harvested mass per hectare and nutrient content with their sources. For a fictional harvest of 5 t/ha and 22 kg N per tonne, removal is 110 kg N/ha. Check whether the mass and concentration share a moisture basis and whether straw was exported or returned. A coefficient borrowed from another crop, region or season adds uncertainty; label it as an estimate instead of a laboratory result.
Test sensitivity before interpreting the sign
If organic-material N content were 2–4 kg per fresh tonne rather than a measured 3, that input would span 40–80 kg N/ha. With the other fictional terms unchanged, the selected balance would span 30–70 kg N/ha. This arithmetic range describes one uncertain input; it is not a statistical confidence interval and does not resolve the missing loss terms.
Keep the audit trail with the worksheet
For every row retain the material or crop, date, mass, area, concentration, basis, nutrient form, provenance and whether the value is measured or estimated. Record exports to another field without counting the same material twice. The blank worksheet and filled example are for organising evidence. Interpretation and an actual application plan require the applicable national rules, current testing and qualified local agronomic advice. This new guide is attributed to the RAMIRAN Research Index editorial organisation, not to historical conference researchers.
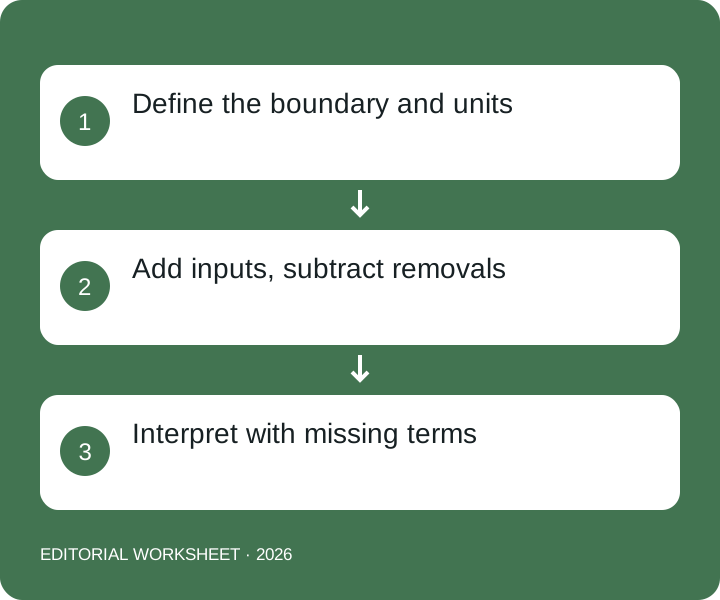
Text equivalent: Define the boundary and units → Add inputs, subtract removals → Interpret with missing terms.
Prepare a local worksheet
Your text stays in this page. It is not sent, stored or checked for accuracy. Use anonymised examples.
The balance-note builder needs JavaScript. The explanation and example fields remain readable.
Download blank worksheet and filled example ↓
Primary context and limits
FAO: nutrient inputs and outputs, historical technical context · FAOSTAT: Cropland Nutrient Balance metadata, December 2025
Convert nutrient results without mixing fresh and dry mass
Two laboratory values can look comparable while using different denominators. A concentration per kilogram of dry matter excludes water; a concentration per kilogram of fresh material includes it. Before adding a result to a nutrient balance, copy both the numerator and the mass basis from the report.
State the fraction before the multiplication
Let d be the dry-matter fraction of fresh mass. A report of 25% dry matter means d = 0.25, not 25. If a nutrient concentration is CDM kg per tonne of dry matter, the corresponding fresh-mass concentration is CFM = CDM × d kg per tonne of fresh material. The inverse is CDM = CFM ÷ d, provided d is known and positive.
This is a mass-basis conversion, not a fertiliser recommendation. It does not convert total nitrogen into plant-available nitrogen, elemental phosphorus into phosphate, or one analytical method into another. Those are separate questions requiring the report, an appropriate source and the relevant field conditions.
A fully labelled teaching calculation
Suppose a fictional material has 25% dry matter and 12 kg total N per tonne of dry matter. One tonne of fresh material contains 0.25 tonnes of dry matter. Its total N content is therefore 12 × 0.25 = 3 kg per tonne of fresh material. Ten tonnes of that same fresh material contain 30 kg total N.
Check the inverse: 3 ÷ 0.25 = 12. At 50% dry matter, the same dry-basis concentration would correspond to 6 kg N per fresh tonne. That second value is another hypothetical case, not evidence that any named manure has that composition. Changing the water fraction changes the fresh-mass denominator.
A report-reading sequence
- Copy the sample ID, sampling date, analytical method and exact concentration unit.
- Identify whether the result is fresh mass, dry matter or another basis.
- Record the measured dry-matter fraction from the same representative sample.
- Write the conversion with its units before entering a number.
- Check the inverse and keep the original value beside the converted one.
A missing fraction is unknown, not zero. Reject negative fractions and values above 100%; do not “repair” them by guessing. If the nutrient and dry-matter values come from different batches or sampling dates, note the mismatch and ask the laboratory whether conversion is appropriate.
FAO's analytical terminology distinguishes as-received and dry-matter bases. The worked values and the accompanying diagram are independently constructed teaching examples. They do not describe a RAMIRAN field trial or establish an application rate. Keep uncertainty and sampling representativeness visible when the converted value enters a real balance.
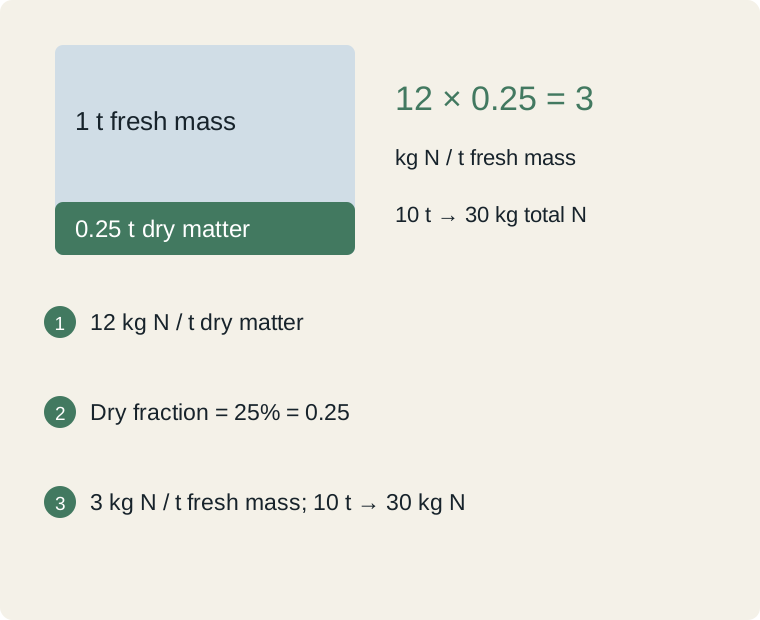
Text equivalent: 12 kg N / t dry matter → Dry fraction = 25% = 0.25 → 3 kg N / t fresh mass; 10 t → 30 kg N
| Field | Completed example |
|---|---|
| Sample and date | Fictional teaching sample |
| Original result and mass basis | 12 kg total N/t DM |
| Dry matter percent | 25% |
| Fraction d | 0.25 |
| Fresh-basis calculation | 12 × 0.25 = 3 kg N/t FM |
| Inverse check / limitations | 3 ÷ 0.25 = 12; no availability claim |
Try the same conversion in either direction
Original teaching calculator for the worked example above. Copy a concentration basis and dry-matter result from the same sample before comparing values. These defaults are fictional, not measured manure or a recommended dose.
CFM = CDM × dry% ÷ 100; CDM = CFM ÷ (dry% ÷ 100). Total N = CFM × fresh tonnes. Zero or unknown dry matter cannot support this two-way conversion. More than 1,000 kg N/t DM is inconsistent with the stated total-N mass basis; check the original report instead of accepting it. Inputs stay in this page; this new form sends or saves none.
For practical context, AHDB distinguishes total and dry-weight loading rates. Its RB209 Section 2 covers organic materials. Local rules, representative analysis and qualified advice remain necessary for field use.
Blank worksheet and worked example ↓
Primary context: FAO: analytical mass-basis terminology