The output is not the end of the story
Anaerobic digestion converts part of the biodegradable material into biogas. It does not make the nutrients disappear. Digestate still needs characterisation, storage, transport and a field destination that fits crop requirements and local safeguards.
Ask for a material analysis
Feedstocks and process conditions vary, so generic nutrient tables are a poor substitute for a current analysis. The information a user needs includes nutrient concentration, dry matter and any contaminants relevant to the input stream. A plan should also account for how quickly nutrients may become available after application.
Map every fraction
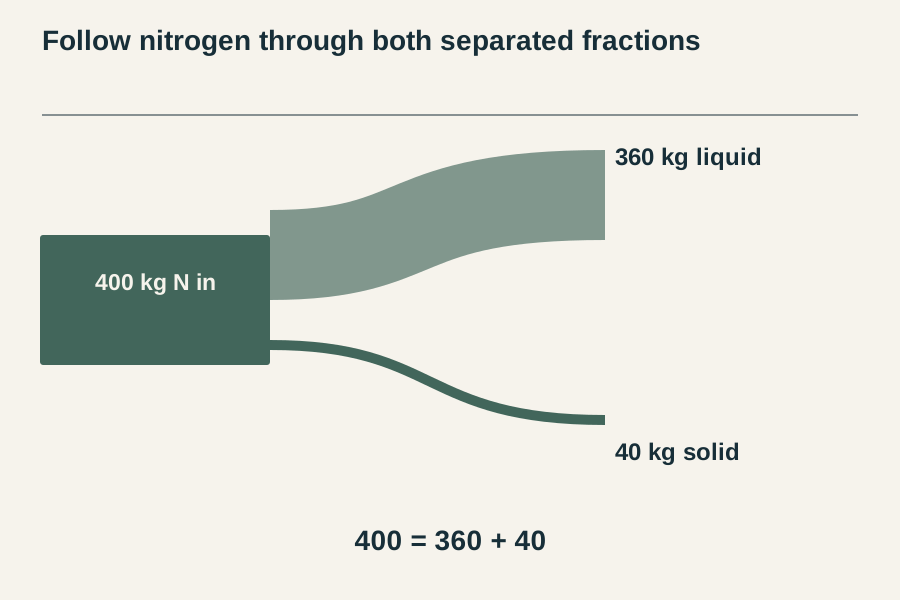
If digestate is separated, the solid and liquid fractions have different volumes and handling characteristics. Each fraction needs a use. Separation may improve transport economics for one output while leaving another close to the plant. Map those destinations before presenting the technology as a circular solution.
Evaluate benefits and trade-offs together
A meaningful comparison follows energy, nutrient recovery, storage emissions and field effects over the entire chain. Conference research often compares systems rather than isolated machines. That is the right level for planning: a biogas project should improve the whole material pathway, not only the energy balance.
Sources & further reading
- FAO: Climate-Smart Agriculture Sourcebook (2013), livestock chapter ↗
- FAO: Organic Matter Database ↗
- Wageningen University & Research: Manure management options ↗
Editorial guide. Local regulations, material testing and qualified advice govern real-world application.
Compare compost and digestate on the same laboratory basis
Two analyses cannot be compared responsibly until their units and sample bases match. This fictional laboratory worksheet helps request missing information before a field decision. It is not a nutrient recommendation, a spreading rate or a claim about a particular product.
- Record the sample date, material identity and laboratory method. Ask whether a result is per tonne of fresh material or per tonne of dry matter. Do not mix total nitrogen with ammonium nitrogen or a modelled plant-available fraction.
- Convert only when the necessary measurement exists. In the example, material A contains 25% dry matter and 12 kg total N per tonne of dry matter: 0.25 × 12 = 3 kg total N per tonne fresh. Material B is already reported on a fresh basis.
- Compare the same field question: what information is still needed for this crop, soil, season and regulatory setting? Total nutrient mass alone does not establish crop availability, soil suitability or legal permission.
- Hold the decision when contamination, salinity, stability, storage history or applicable requirements remain unknown. Request the relevant analysis and qualified local interpretation rather than treating a blank cell as zero.
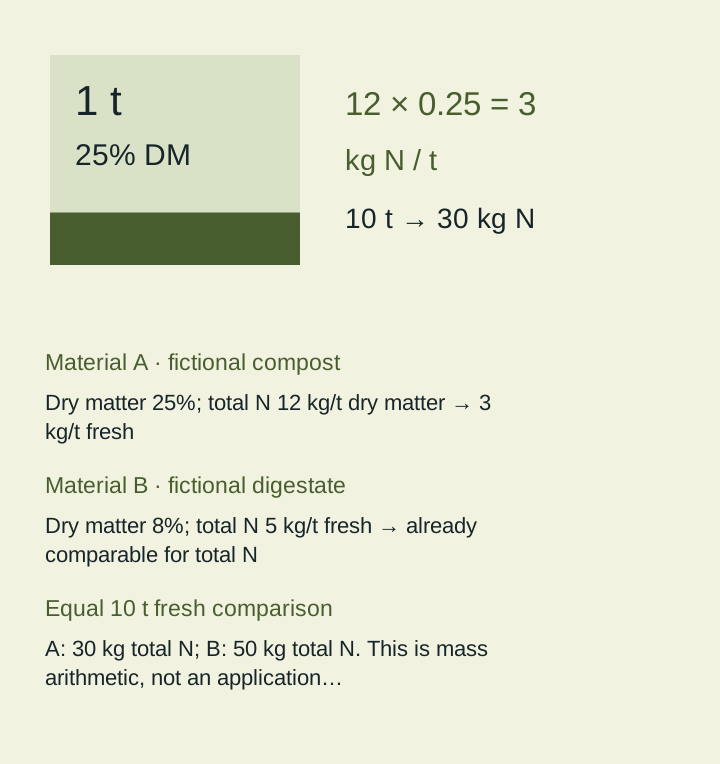
Diagram text: Material A · fictional compost: Dry matter 25%; total N 12 kg/t dry matter → 3 kg/t fresh; Material B · fictional digestate: Dry matter 8%; total N 5 kg/t fresh → already comparable for total N; Equal 10 t fresh comparison: A: 30 kg total N; B: 50 kg total N. This is mass arithmetic, not an application recommendation.
| Field | Example or check |
|---|---|
| Material A · fictional compost | Dry matter 25%; total N 12 kg/t dry matter → 3 kg/t fresh |
| Material B · fictional digestate | Dry matter 8%; total N 5 kg/t fresh → already comparable for total N |
| Equal 10 t fresh comparison | A: 30 kg total N; B: 50 kg total N. This is mass arithmetic, not an application recommendation. |
| Still missing for both | Ammonium N, availability assumptions, crop need, soil analysis, contaminants and local limits |
| Decision record | No field rate selected; responsible adviser requests the missing tests. |
Do not infer that B is “better” from the higher total nitrogen alone. The materials can serve different purposes, and losses depend on handling and conditions. Keep the original laboratory report with the converted worksheet so another reader can reconstruct both the calculation and its limits.
Source context: Wageningen University & Research: compost handbook
Below a reporting limit is not the same as zero
A digestate table can contain numbers, inequalities and method qualifiers. Copy them together before calculating or comparing. The synthetic report below teaches how to read a qualified result; it is not a sample analysis, an application recommendation or a compliance assessment.
- Copy the sample identity, date, material basis, units, method and every qualifier. Ask the laboratory whether its “<” means a detection limit, a quantification limit or another reporting convention.
- Compare only matching analytes and bases. A result in milligrams per kilogram of dry matter is not directly comparable with a fresh-mass result without the corresponding dry-matter information.
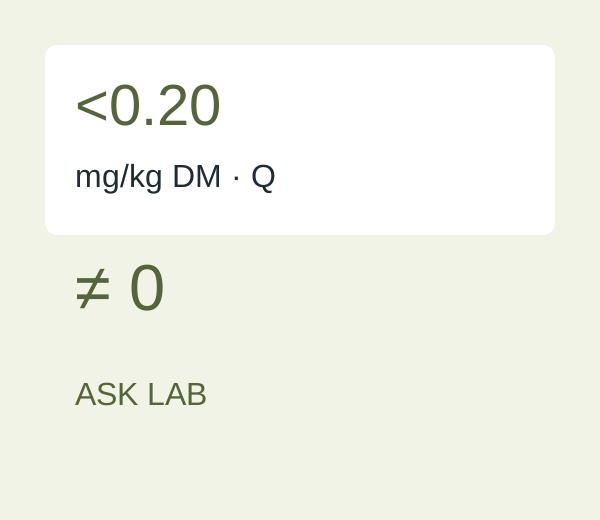
- Keep an inequality as an inequality. Do not replace “<0.20” with zero, 0.10 or 0.20 merely to make a spreadsheet calculate a mean.
- Before a decision, request the meaning of the qualifier, uncertainty where applicable, and the decision rule used against the relevant current requirement. Leave compliance unresolved without those inputs.
| Field | Example or check |
|---|---|
| Synthetic analyte A | <0.20 mg/kg dry matter; laboratory code Q. Meaning of Q and of the threshold must be obtained from that laboratory. |
| Synthetic analyte B | 0.35 mg/kg dry matter. A reported number alone does not identify its uncertainty or prove it is comparable with another method. |
| What A establishes | The report places A below its stated reporting threshold for that procedure. It does not establish absolute absence. |
| Unsafe spreadsheet change | Entering zero discards the limit and qualifier. Keep original_result = “<0.20”, unit = “mg/kg DM”, qualifier = “Q”; analysis_value remains unresolved. |
| Laboratory question to copy | For sample __ and analyte __, what does __ mean? Is it LOD or LOQ? Which basis, uncertainty and decision rule apply to the intended comparison? |
Detection, quantification and a regulatory decision are different questions. Do not turn this illustrative threshold into a limit for any real digestate or jurisdiction.
Sources: IUPAC — limit of detection